


20 May 2026
While the UK’s relationship with alcohol is deeply cultural, the reality of dependence is a growing crisis that affects over 608,000 alcohol-dependent adults in England. Behind every statistic are even more people, families and communities impacted by alcohol addiction.
In this article, we delve into various aspects of alcohol consumption, its impact on health, the challenges of alcohol dependence, and the available treatment options, to bridge the gap between data and recovery. All the statistics presented here are sourced from reputable sources, including the NHS and ONS, to ensure accuracy and reliability.
Source: Rehabs UK
Alcohol consumption in the UK
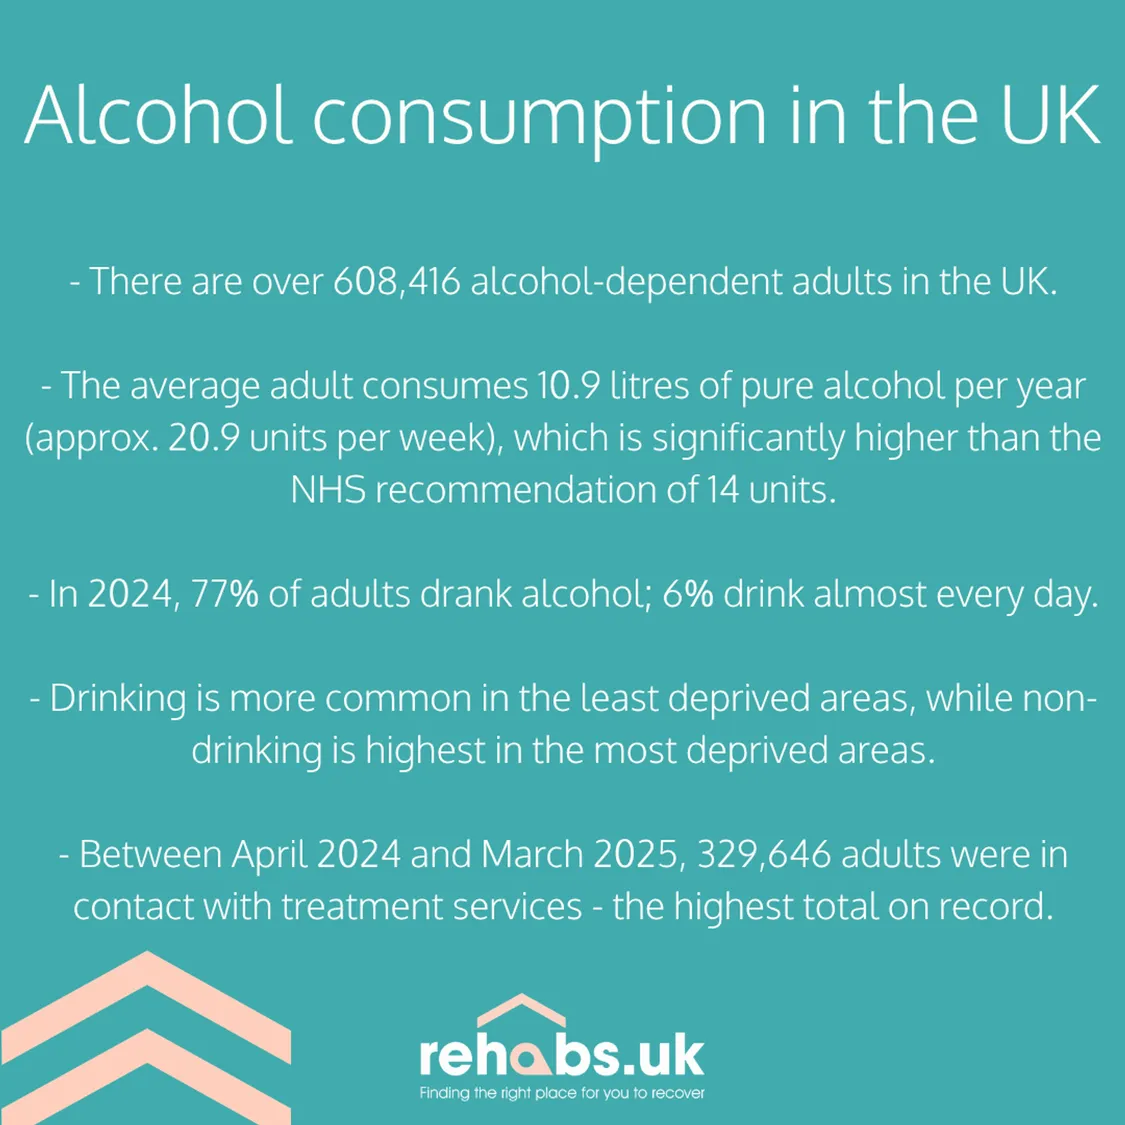
The latest WHO data shows that average consumption per adult is about 10.9 litres of pure alcohol per year – or about 20.9 units a week. For context, the NHS recommends no more than 14 units per week on a regular basis.
- In 2024, 77% of adults had drunk alcohol in the last 12 months.
- 44% drank at least once per week.
- 23% drink 1-2 times per week.
- 6% drink alcohol almost every day.
Sources: 2024 Health Survey for England (HSE) - Published January 2026, HSE 2024 Adults' health-related behaviours tables (Table 8)
The number of adults who did not drink alcohol in the last 12 months has increased:
Based on the following data, across England, Scotland and Wales, the average number of weekly units is estimated to be 11.28.
- England (2024): 12.8 units.
- Scotland (2024): 11.3 units.
- Wales (2022/23): 9.7 units (508 units per year).
A report by Alcohol Change UK reveals that 1 in 5 people feel pressured by friends to drink—highlighting the growing issue of sober shaming in social settings.
Sources: 2024 Health Survey for England (HSE) - Published January 2026, HSE 2024 Adults' health-related behaviours tables (Table 9), The Scottish Health Survey 2024 - volume 1: main report, Chief Medical Officer For Wales Annual Report 2024-2025.
Alcohol consumption by age
Source: 2024 Health Survey for England (HSE)
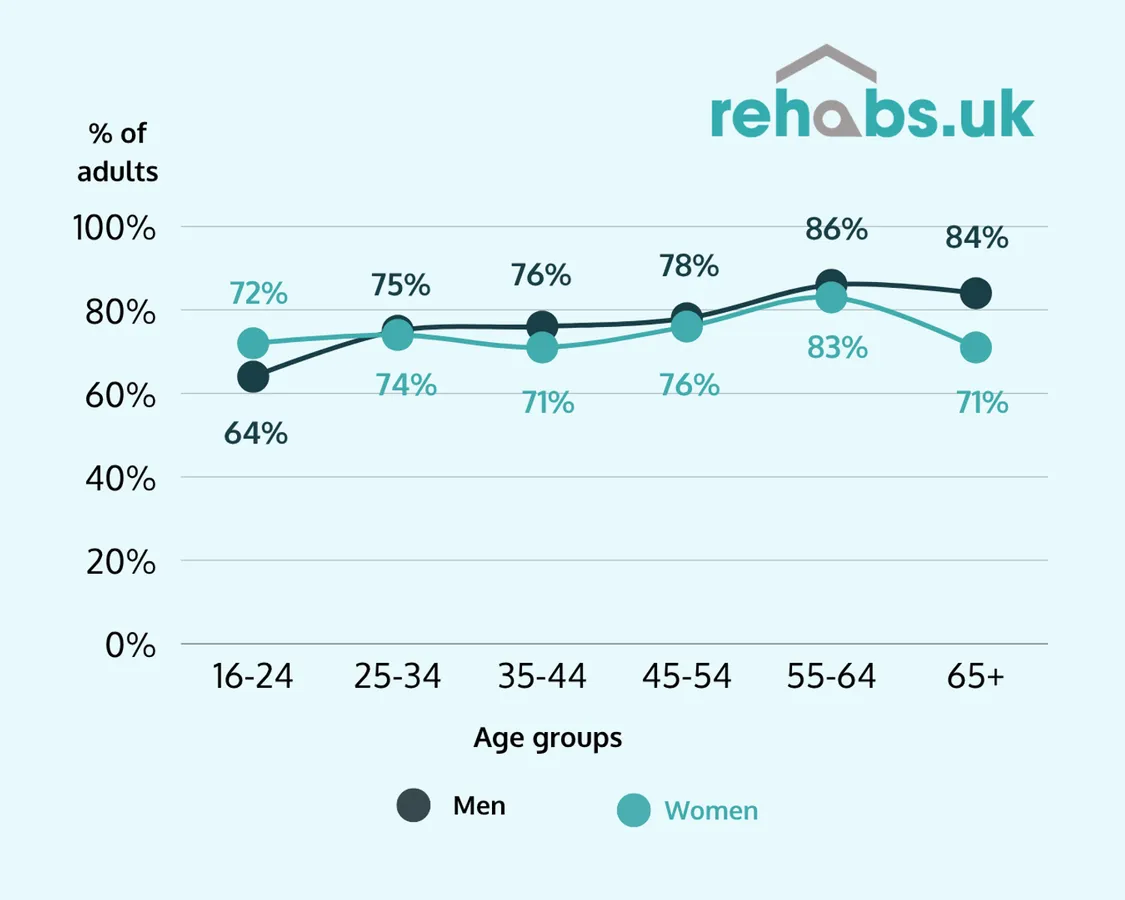
The number of people drinking alcohol in the last 12 months gradually increases with each generation, peaking between the ages of 55 and 64.
- Drinking alcohol in the last 12 months (Men):
- Aged 16 to 24: 64%.
- Aged 25 to 34: 75%.
- Aged 35 to 44: 76%.
- Aged 45 to 54: 78%.
- Aged 55 to 64: 86%.
- Aged 65 and over: 84%.
- Drinking alcohol in the last 12 months (Women):
Underage drinking
- In 2023, the number of pupils in England who said they had ever had an alcoholic drink was 37%, down from 44% in 2016.
- Uptake in alcohol use increases rapidly in the teenage years
- 5% of pupils said they drank alcohol at least once per week, slightly lower than the 6% in 2021.
Source: 2024 Health Survey for England (HSE) - Published January 2026, HSE 2024 Adults' health-related behaviours tables (Table 8), Smoking, Drinking and Drug Use among Young People in England, 2023 - Published October 2024
Alcohol consumption by gender
- In 2024, 78% of men and 75% of women had drunk alcohol in the last 12 months.
- 50% of men had drunk alcohol in the past week, compared to 38% of women.
- More than a quarter of men (27%) drank over 14 units a week, putting them at a higher risk of harm. 15% of women drank to that level.
- 5% of men drank at higher risk levels (over 50 units per week).
- 3% of women drank at higher risk levels (over 35 units per week).
Source: 2024 Health Survey for England (HSE) - Published January 2026
Regional comparisons
England
- Adults in Yorkshire & the Humber (28%) and the South West (24%) are most likely to drink more than 14 units per week.
- Adults are more likely to drink over 35/50 units per week in the North East (6%) and Yorkshire & the Humber (6%). The West Midlands (2%) has the lowest level in England.
- Non-drinkers are most common in the West Midlands (36%) and North West (30%).
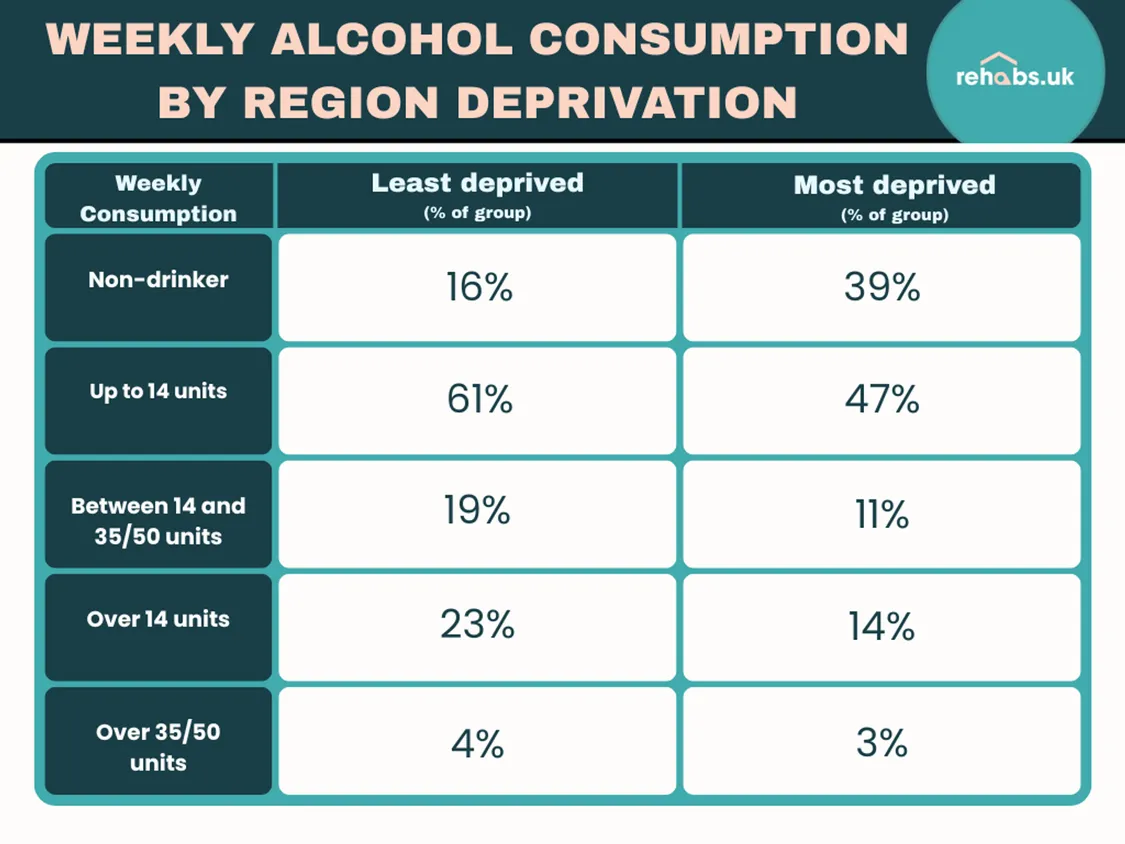
- The number of non-drinkers increases based on the level of deprivation, with the lowest figure (16%) found in the least deprived areas and 39% in the most deprived areas.
- This trend is reflected in alcohol consumption, consistently being more common in the least deprived areas than the most deprived.
Weekly alcohol consumption by region deprivation
Sources: 2024 Health Survey for England (HSE)
- Non-drinkers are significantly more common in the most deprived areas, accounting for 39% of the population, compared to just 16% in the least deprived areas.
- Consuming up to the recommended limit of 14 units is most common in the least deprived areas (61%) compared to under half (47%) in the most deprived areas.
- Individuals living in the least deprived areas are more likely to exceed standard weekly alcohol guidelines, with 23% consuming over 14 units per week, compared to only 14% in the most deprived areas.
- Increased risk drinkers (those consuming between 14 and 35/50 units a week) are more highly concentrated in affluent areas (19%) than in the more deprived (11%).
- While affluent areas show higher drinking rates across almost all levels of use, the disparity shrinks in people drinking over 35/50 units per week - 4% in the least deprived areas and 3% in the most deprived.
Sources: 2024 Health Survey for England (HSE) - Published January 2026, HSE 2024 Adults' health-related behaviours tables (Tables 11 and 12)
- In 2023, the highest rate of alcohol-specific deaths in England was in the North East (25.7 per 100,000) The lowest was in the East of England (11.5 per 100,000).
- Based on a broad measure of alcohol-related hospital admissions, the rate in 2023/24 was 1,824 per 100,000.
Source: Alcohol-specific deaths in the UK: registered in 2023, Alcohol Profile for England
Scotland
- In 2023, Scotland continued to have the highest rate of alcohol-specific deaths in the UK (22.6, with the rate in Scotland remaining unchanged compared with 2022).
- However, in 2024, 1,185 people in Scotland died from alcohol-specific causes - the lowest figure since 2019.
- Since its introduction, Minimum Unit Pricing (MUP) has been estimated to have reduced alcohol-related deaths by 13.4% in Scotland.
- In 2024, the number of men who drank to ‘hazardous or harmful’ levels (29%) was more than double that of women (13%).
- The highest level of hazardous drinking was found in the 55-64 age group (28%).
- Drinking to ‘hazardous or harmful’ levels was more common in the least deprived areas (26%), compared to the most deprived (15%).
- The mean units of alcohol consumed per week was 11.3 units. The joint lowest level records are the same as 2021.
- Between 2003 and 2024, the number of non-drinkers has increased from 11% to 20%.
Sources: Alcohol-specific deaths in the UK: registered in 2023, The Scottish Health Survey 2024 - volume 1: main report
Wales
- In 2023, Wales had an increase in the rate of alcohol-specific deaths (17.7 deaths per 100,000 people) compared with 2022.
- This rate has trended upwards since hitting a low of 11.9 in 2019.
- The 2024-25 National Survey for Wales revealed that:
Sources: Alcohol-specific deaths in the UK: registered in 2023, National Survey for Wales headline results: April 2024 to March 2025
Northern Ireland
- In 2024/25, 76% of adults drank alcohol, a slight decrease from 78% in 2023/24.
- Since 2010/11 (25%), the number of adults drinking above weekly alcohol limits has fallen to 13%.
- 45% drink at least once a week, down fromm 58% in 2020/21.
- While 40% drank the most with their partner, or with a combination of friends and family (52%), 6% drank the most alcohol alone.
Source: Health survey Northern Ireland: first results 2024/25
- In 2023, Northern Ireland had the second-highest rate of alcohol-specific deaths in the UK (18.5 deaths per 100,000 people) but this marked a decrease compared with 2022.
Source: Alcohol-specific deaths in the UK: registered in 2023
Health impact statistics
Alcohol-related hospital admissions
- In 2023/24, NHS England and Office for National Statistics data show alcohol-related hospital admissions at 504 per 100,000 people.
- While this is an increase from 2022/23 (475 per 100,000), admission levels in England have generally remained consistent since 2016/17 (429 per 100,000).
- The peak in this period (2016-2024) was 518 per 100,000 in 2019/20.
Source: DHSC Fingertips Public Health Profiles - Admission episodes for alcohol-related conditions (Narrow)
Deaths
- The latest government data reveals that 2023 had the highest rate of alcohol-specific deaths since records began, breaking the record for the fourth year in a row. 10,473 deaths from alcohol-specific causes were registered in the UK - 4% higher than in 2022 (10,048 deaths; 16.6 per 100,000).
- The rate of alcohol-specific deaths for men is close to double the rate for females (21.9 and 10.3 deaths per 100,000).
Source: Alcohol-specific deaths in the UK: registered in 2023
Problem drinking and treatment
According to the most recent government estimations, there are more than 608,416 dependent adult drinkers in the UK, showing signs of an increase since 2015 (2020 data, last updated in 2024).
Higher-risk drinking can be assessed with the Alcohol Use Disorders Identification Test (AUDIT) questionnaire, with an overall score of 40.
The following insights cover England and consider increasing-risk drinking behaviour to be a score of 8+, higher-risk alcohol problems requiring counselling 16-19, and possible alcohol dependence in scores of 20+.
- Mean average score across adult age groups and gender was 4.4.
- 89% of adults had AUDIT scores indicating low-risk drinking behaviour (93% women, 85% men).
- 9% had scores indicating an increasing risk.
- 1% had scores indicating higher risk.
- 1% had scores indicating possible alcohol dependence.
- Low-risk drinking behaviour increased with age, rising from 83% for 16-24 to 94% in those ages 65+.
- Increasing risk, higher risk or possible alcohol dependence scores decreased with age, falling from 17% for 16-24 to 6% in those ages 65+.
Sources: Estimates of alcohol dependent adults in England - Updated March 2024, 2024 Health Survey for England (HSE) - Published January 2026, HSE 2024 Adults' health-related behaviours tables (Table 15)
Treatment
- Official government figures show that, between April 2024 and March 2025, 329,646 adults in England were in contact with drug and alcohol treatment services.
- This represents a 6% year-on-year increase, and the highest 12-month total since records began.
- 169,542 adults entered treatment in 2024-25, continuing year-on-year increases in 2022 (137,749) and 2023 (158,991).
- 30% of adults in treatment are there for alcohol alone. This is consistent with 2022 and 2023 levels.
Sources: Adult substance misuse treatment statistics 2024 to 2025: report - Published December 2025.
- In the year ending March 2025, 16,212 children were in alcohol and drug treatment in England - a 13% increase from the previous year.
- 38% said they had a problem with alcohol, equating to 6,107 children.
- Of the children in contact with drug and alcohol treatment services in this period, 61% were boys and 39% girls, with a median age of just under 16 years old.
Source: Children's substance misuse treatment statistics 2024 to 2025 - Published 4 December 2025
Source: Adult substance misuse treatment statistics 2024 to 2025
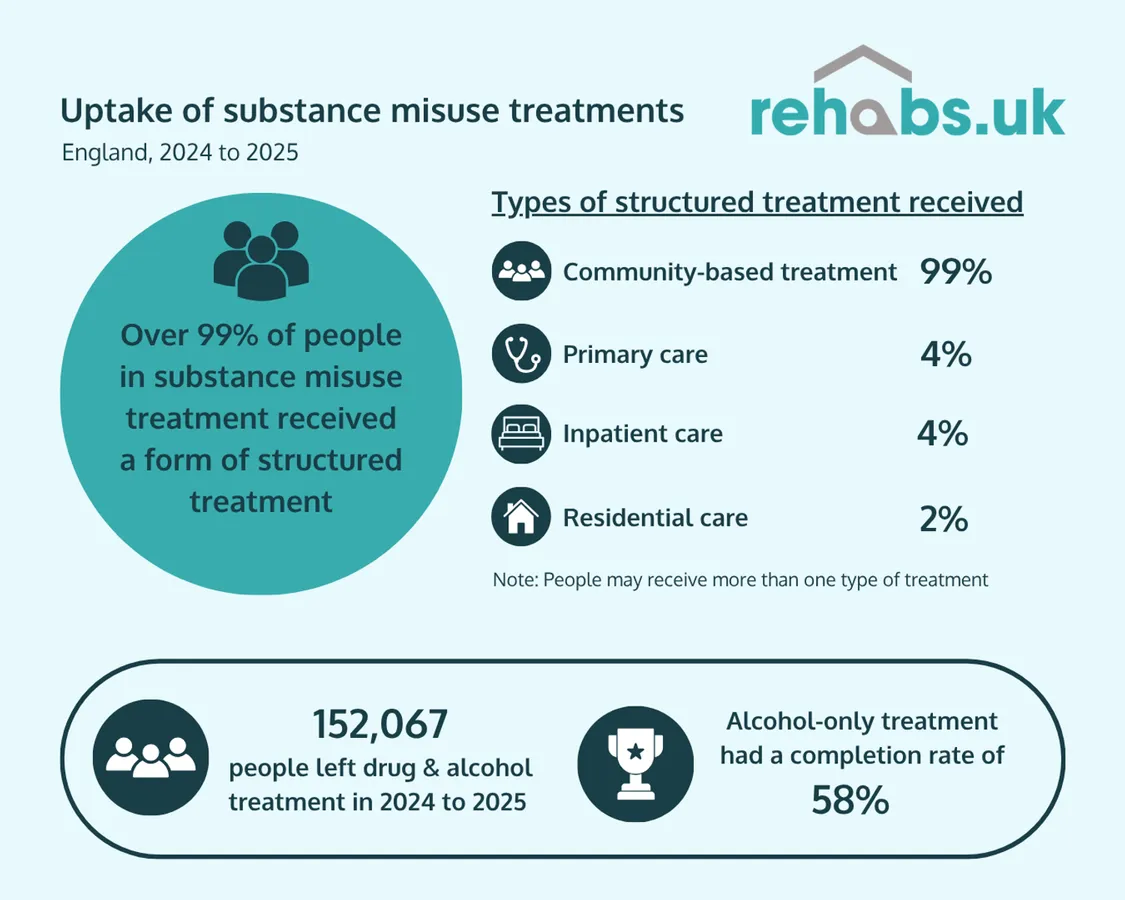
- Over 99% of people in substance misuse treatment in England between 2024 and 2025 received a form of structured treatment.
- Community-based treatment: 99%.
- Primary care: 4%.
- Inpatient care: 4%.
- Residential care: 2%.
- 152,067 people left drug and alcohol treatment in 2024 to 2025. Alcohol-only treatment had a completion rate of 58%.
Sources: Adult substance misuse treatment statistics 2024 to 2025: report - Published December 2025.
Find the right support for alcohol addiction
If you or someone you know is struggling, there are effective and proven treatments available
- Cognitive behavioural therapy
- 12-step programmes
- Residential Rehab
- Outpatient programmes and home detox
- Anti-craving medication for alcoholism
- Holistic non-12 step treatment
- Group therapy
- Counselling
Whether it's detox, rehabilitation, or ongoing support, speaking to a medical professional or an addiction referral service like Rehabs UK is the first step towards recovery.
Contact Rehabs UK to get the advice and support you need.